2 Hello RLadies
All chapters of RLadies are condensed under RLadies Global and each chapter will try to showcase the topic by as many RLadies chapters as possible without redundancy.
2.1 StaRt here
This section is about starting in RStudio using R. This starter code is from RLadies Freiburg repo. Starting out with using base R which entails the use of the $ dollar sign, which is used to grab a specific column from a dataset.
The dataset you will use is from a library called datasets which is a R package that contains various datasets to be used for your learning needs. Using either a simple .R file or Rmd file with a {r} code chunk, enter the code below for basic descriptive statistics.
#--- step one is to install the library package
# install.packages('datasets') # comment out to run
library(datasets) # load library
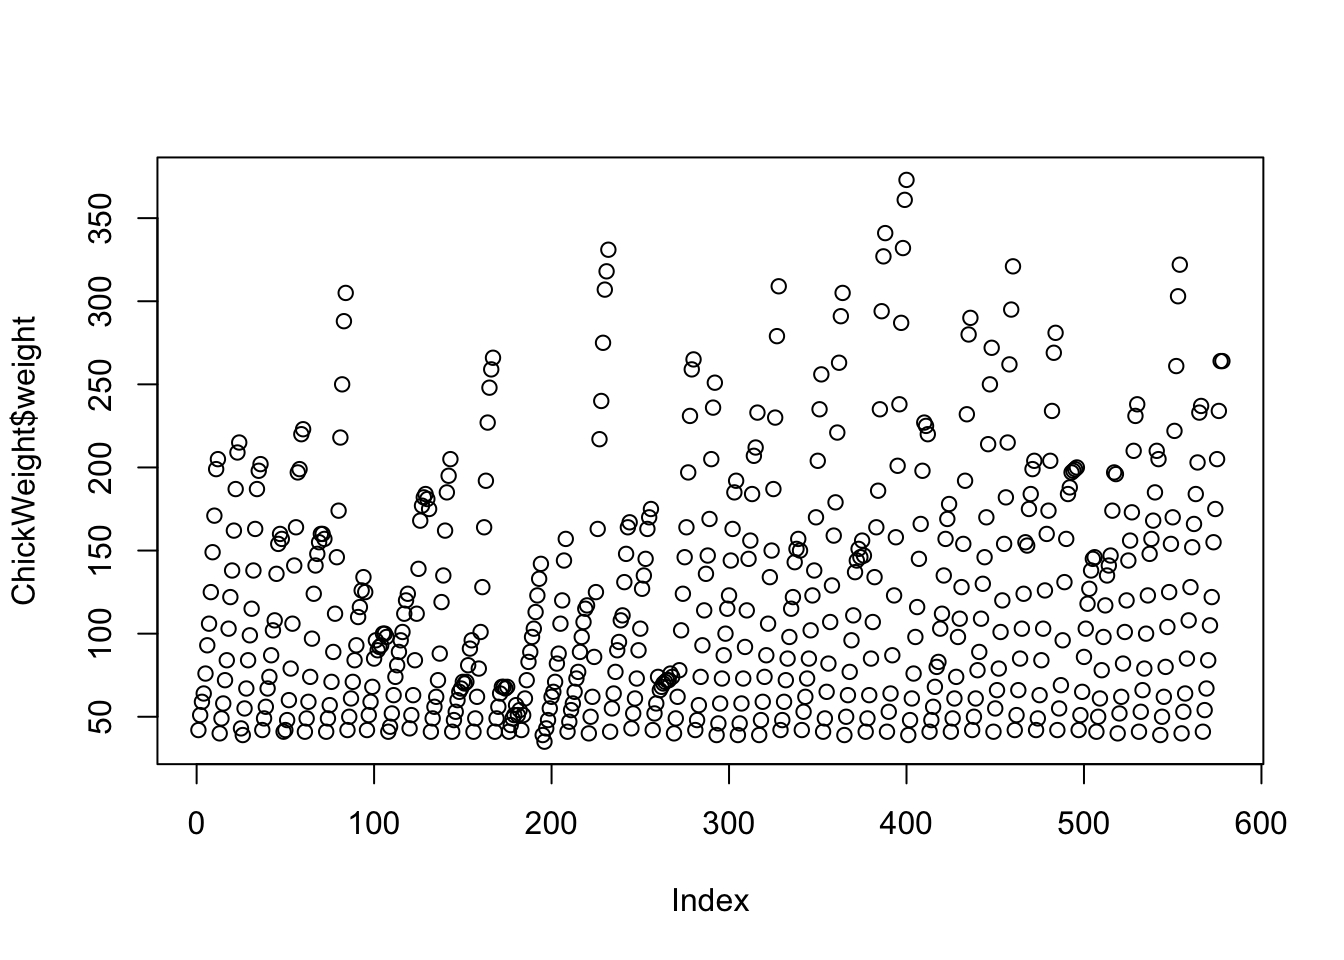
# the specific dataset we want is called ChickWeight
data("ChickWeight") # function to pull out specific dataset
head(ChickWeight) # see first 6 rows of dataset
#> weight Time Chick Diet
#> 1 42 0 1 1
#> 2 51 2 1 1
#> 3 59 4 1 1
#> 4 64 6 1 1
#> 5 76 8 1 1
#> 6 93 10 1 12.2 Descriptive Stats
For simple descriptive statistics in R is by using the base R functions like mean(), std() and max(), among others. For this ChickWeight dataset, we want to find the mean weight.
# find the mean weight.
# need to use the $ to pull the data from column 'weight'
# - method 1:
# use the function mean with our dataset$column
mean(ChickWeight$weight)
#> [1] 121.8183
# - method 2:
# make a variable to store our column data
chik_wt = ChickWeight$weight
avg_chick_wt = mean(chik_wt) # save the mean chick weight as variable
avg_chick_wt
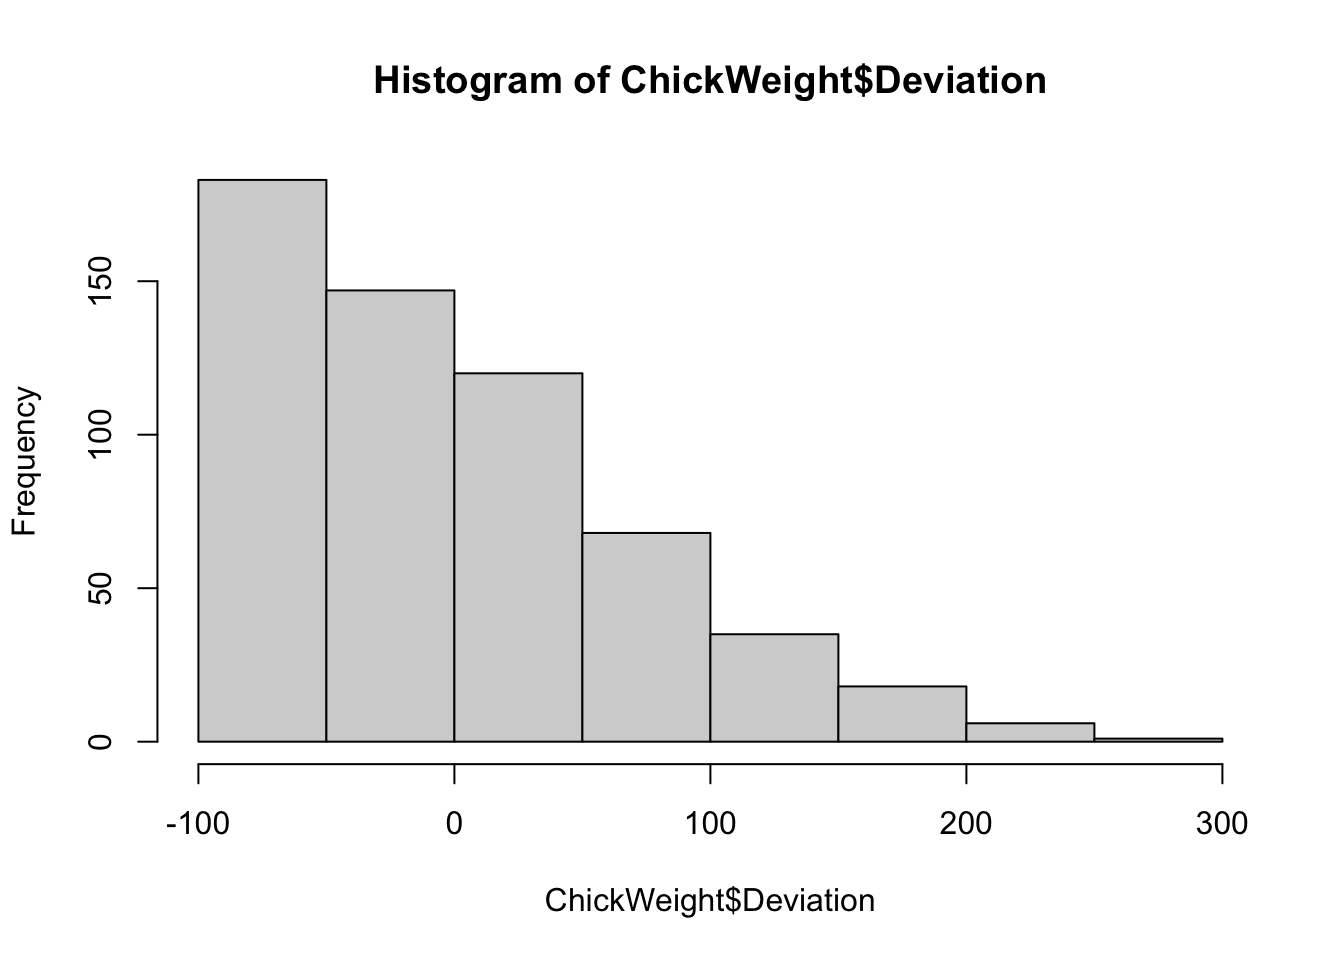
#> [1] 121.8183Now we want to create a new variable for our deviation from the mean weight.
# create new column.
# dataset$NEW_COLUMN_NAME

ChickWeight$Deviation =  ChickWeight$weight - avg_chick_wt
ChickWeight$Deviation[1:10]
#>  [1] -79.818339 -70.818339 -62.818339 -57.818339 -45.818339
#>  [6] -28.818339 -15.818339   3.181661  27.181661  49.181661